Since my last Market Update, the world has been turned upside down. What a difference a month makes! With the COVID-19 situation, we’ve had shelter-in-place orders, mass layoffs, government bailout spending packages, a huge stock market selloff and bounce, and a gigantic disruption thrown into our daily lives.
If you haven’t seen my “Update to the Update” video, where I go into all the market forces that will be affecting us for the next several months, please watch it here. I got a lot of good feedback from it.
However, I’ve been interacting with plenty of my fellow Real Estate professionals, and there’s no consensus on what they think will happen. Some are hopeful for the “V shaped recovery” and are betting that our local Real Estate market won’t be affected very much. Then there are others predicting the next Great Depression, and sharing with me their experiences through the ’08 recession and how this could end up much worse.
In this report, I’m going to show you the facts we have available, and help you make some educated guesses as to what might happen. Bear with me, there’s a lot to cover.
Supply: Inventory Levels
First of all, our NWA Real Estate market was carrying strong momentum coming into the Spring. We had started out the year with the lowest inventory number since January 2015 and homes were selling really fast, often with multiple offers. I was predicting the Spring would turn into an even faster moving Seller’s Market.
And our March numbers for homes on the market across Benton and Washington counties totaled 3,515. We closed out the month with 936 sales, which gives us a Month’s Supply of 3.75. That means that despite the disruption that struck mid-month, March was definitely a Seller’s Market, and normally that would mean prices should continue rising. See the chart below.
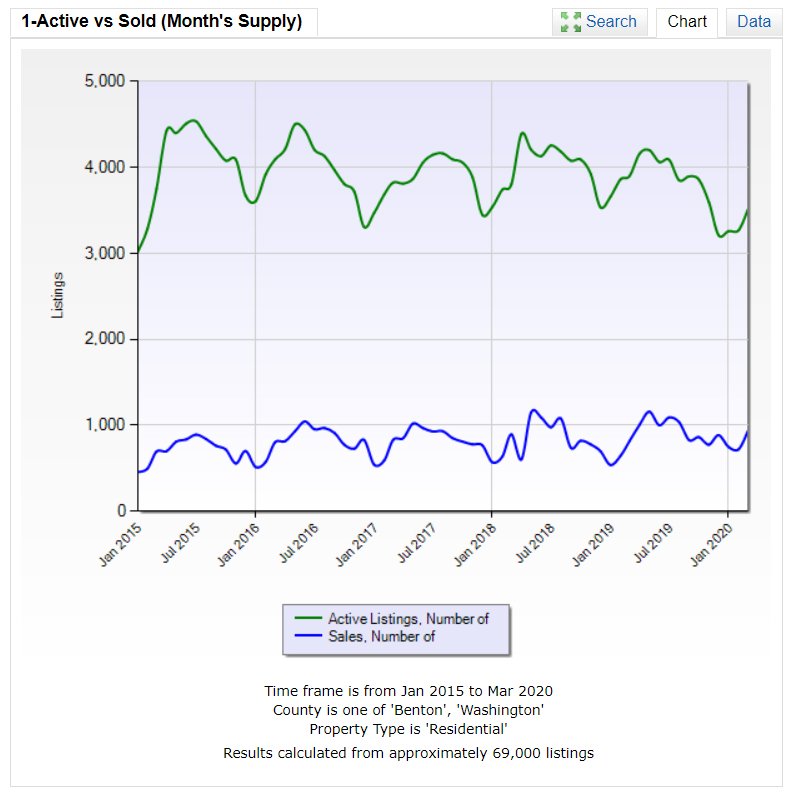
Now, we must keep in mind that even though we closed a lot of homes this month, those homes most likely were already under contract, and so this is essentially a market snapshot from the days before the crisis hit. It’s not necessarily an indication of what’s happening right now. Since Real Estate has such a long settlement period, it’s much different than the constant daily updates that are available in most other markets, especially the Stock Market.
But I have many clients who want to know what’s happening and asking “Is the market going to turn?” “Is it changing?” “Are prices going to crash again like ’08?”
With that in mind, I’ve put together some weekly data points to look at, starting in the first week of March and going through the first 7 days of April. See below.
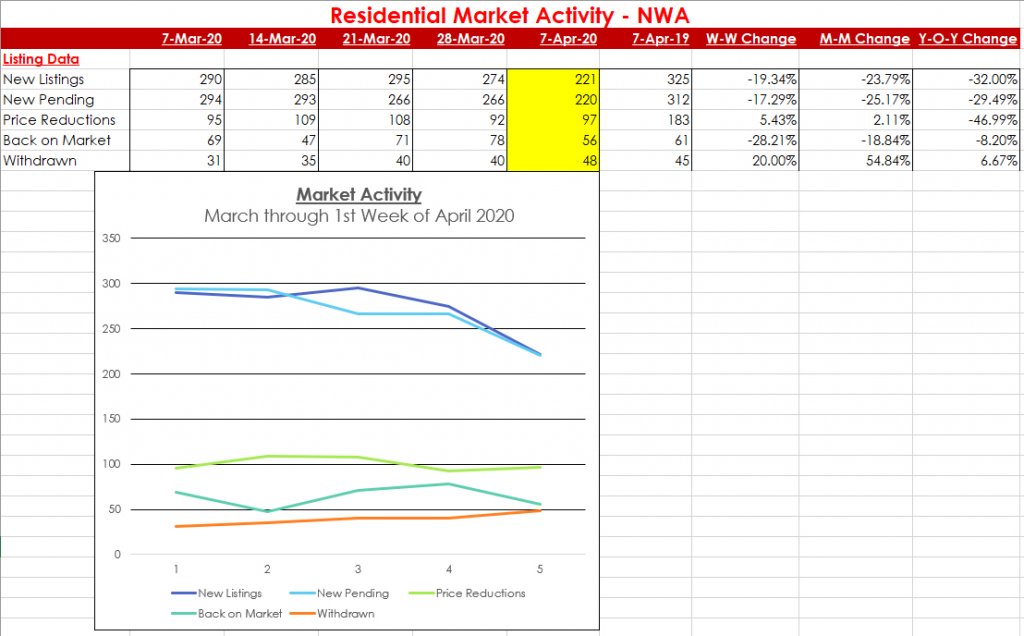
What this graph clearly shows is a drop in market activity since the pandemic hit. The first 7 days of April are showing a -19.34% drop in New Lisitings from the 4th week of March, also a -23.79% drop compared to the 1st week of March, then a -32.00% drop compared to the same week last year (April 2019).
Those are really bad numbers, especially since we have been so low on inventory coming into this. Interestingly, the Pending Listings are following almost the exact same trajectory, which is actually a good sign. That means supply and demand are remaining even for the time being. At the moment, this doesn’t point to a drop in prices.
In fact, we’ve had 46.99% fewer Price Reductions Year-over-Year for the first 7 days of April. And even week to week, we’re not seeing more sellers dropping prices. For now, these prices are holding.
Now, we did have a bump in “Back on Market” listings at the end of March, which most likely has to do with some Buyers being forced to cancel contracts due to the shake up. However, that number didn’t climb as much as you might have thought, and wasn’t that much different than normal activity.
Demand: Mortgages and Jobs
Now typically, the numbers above would actually lead to higher prices, since we’re actually seeing a lower supply. If demand remains strong, we would undoubtedly see home prices rise. But that’s the key word: “If.”
Because if demand falls dramatically faster than the supply falls, we could still have prices trending downward.
When evaluating the Demand side of Real Estate, we must take two things into account: Buyers’ ability to qualify for and pay for Financing. That means Mortgage Availability and Jobs numbers play the most important roles here.
On the Mortgage front, rates have never been lower. We’re seeing rates below 3%, even as low as 2.75% in some cases. In theory, this should drive a ton of demand for houses as those monthly payments are about as low as they can get.
However, due to this shake up and the uncertainty about the forbearance & deferments the government is enacting, lenders are requiring higher credit scores to get those loans. Other requirements may become more strict as well, such as higher cash reserves, higher down payments, etc. There are a lot of ideas being thrown around to make these loans more secure. Which in turn makes it harder to qualify, thus reducing our Buyer Pool going forward.
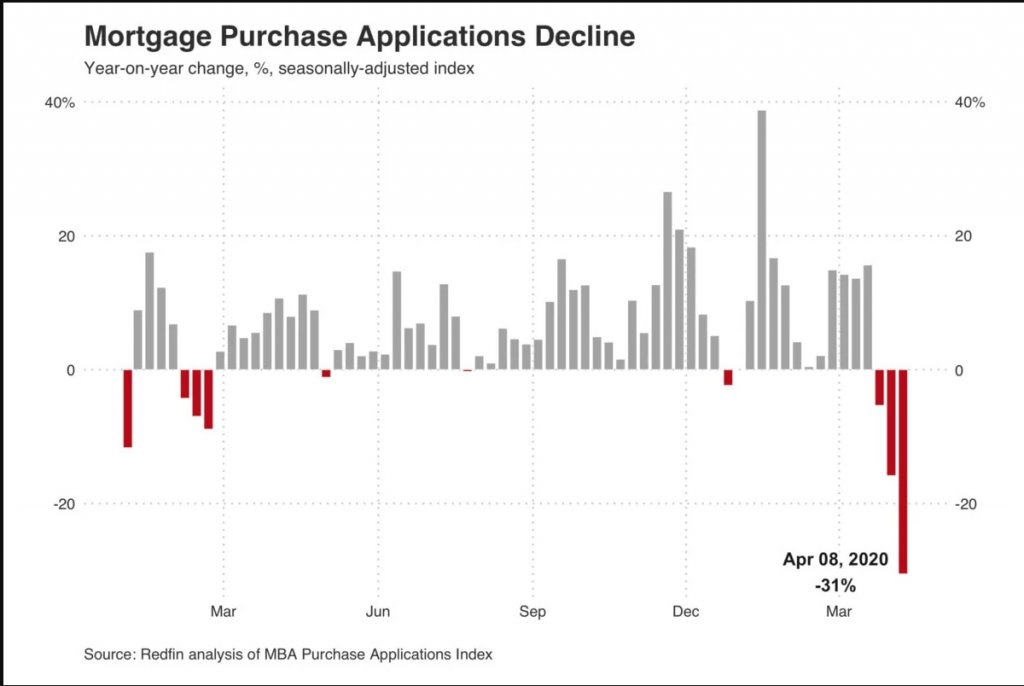
Plus, Buyers seem to be sitting on the sidelines as well. Nationwide, Mortgage applications fell 31% from the prior year on Wednesday. (Source: Redfin)
But the biggest blow is something I discussed in the last update video on Facebook. The biggest factors in all of this are INCOME & JOBS.
If people aren’t employed, they can’t buy houses. The Jobs Numbers are the big factor to watch over the next several months. And right now they don’t look good.
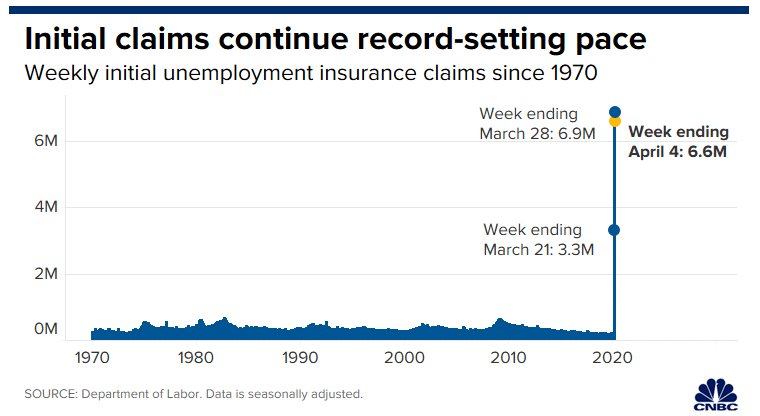
We’ve got weekly unemployment claims numbers that have never been seen before in the US. We’ve lost 10% of our work force in 3 weeks. This includes many Arkansans. In fact, Arkansas had about 4.5% of our workers apply just last week.
If this economic shutdown continues through the spring, I do see a massive disruption to our local Real Estate market. The key factor in all of this is how quickly people can get back to work, and how many of our local businesses can survive this historic shutdown.
I’m not an economist, or a financial planner, but there do seem to be some dark days ahead for many, many people in our nation and our state. There are concerns about the stock market, the amount of debt we all have, and even the potential weakening of our currency through inflation. Many financial experts are bracing for a hard impact to our economy. Even Ray Dalio is claiming we are entering a Depression, which will take years to climb out of. (Video of his Ted Talk here.)
However, as your Real Estate professional, I may be able to give you some good news if you’ve been wanting to sell your home this Spring. Stay with me to the end of this article.
Average Sale Price and Days on Market
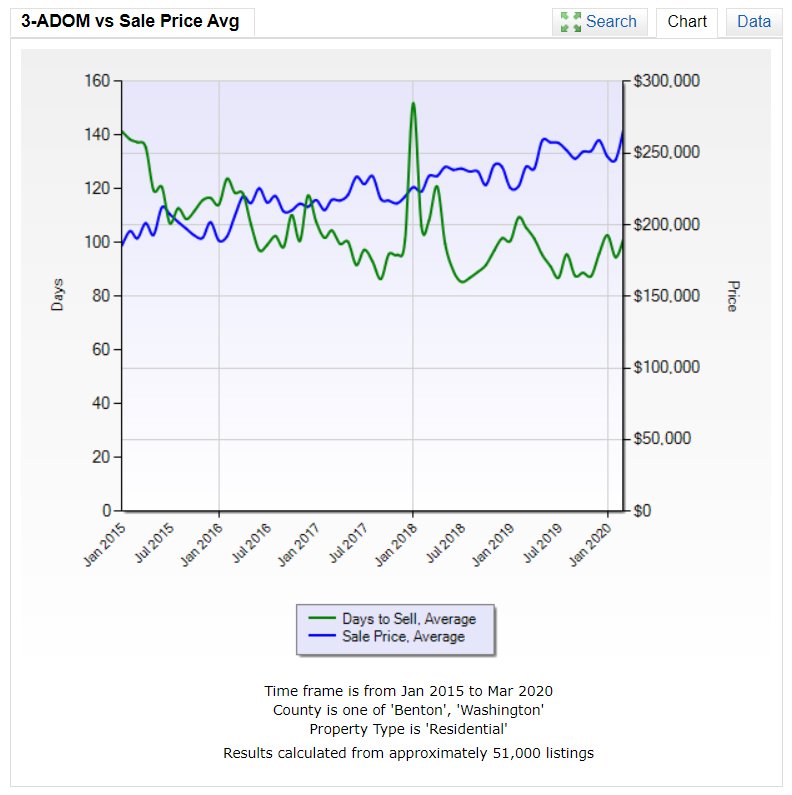
For now, home sellers have been enjoying higher sale prices. We hit an all time high in March at an Average Sale Price of $266,077, across Washington and Benton Counties. Average Days on Market came in at 101, which is still very fast since that number includes the time to build new construction homes and the 30-45 day closing period for resale homes.
What it all Means for You
If you’ve been thinking of selling your home, PLEASE listen to me. We may be at a price peak right now for a few more weeks. You may not be able to sell your home at these kinds of prices if you miss this window of opportunity.
If we do see a price decline in Real Estate, there’s no telling how long it may take to recover. This decline won’t look exactly like the last Recession, but there are lessons to be learned from it. In that one, it took Real Estate 7 to 8 years to get back to the previous highs.
Are you prepared to stay in your current home for the next 7-10 years? If not, let’s chat.
Don’t misunderstand me, I hope I’m wrong, but it looks like a shift is on the horizon, and I want you to make it through in the best possible position.
I book Free Strategy Sessions for all my clients. No pressure or obligation, but I’d be happy to help you put a solid plan in place to get you into the home you’ve been dreaming of.
Would it make sense to chat for a few minutes?
Just book a FREE Strategy Session with me Here to block out your own time on my calendar.
You could also Send me a message or give me a call today! (479) 777-3379
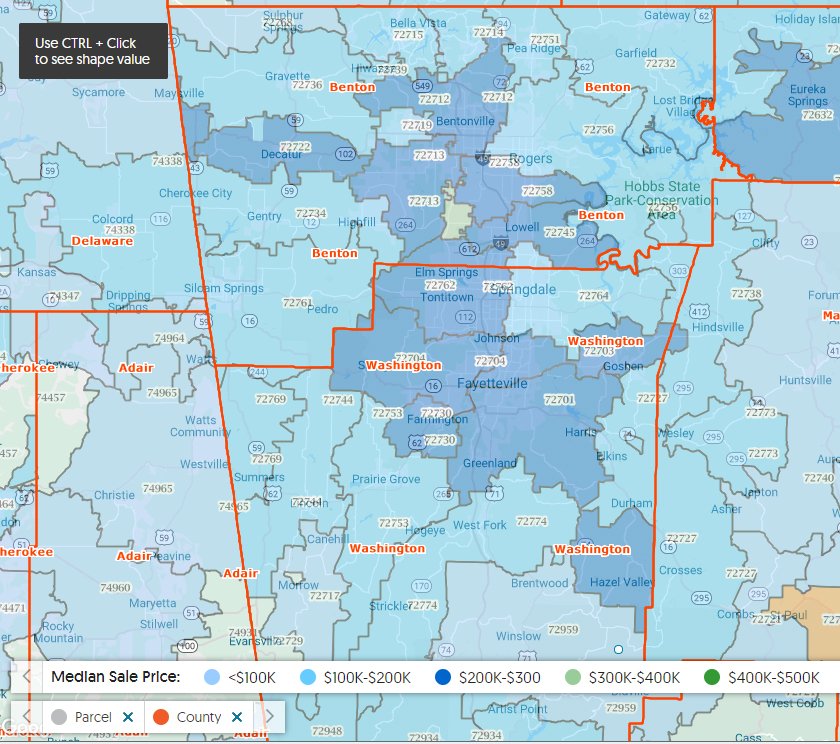
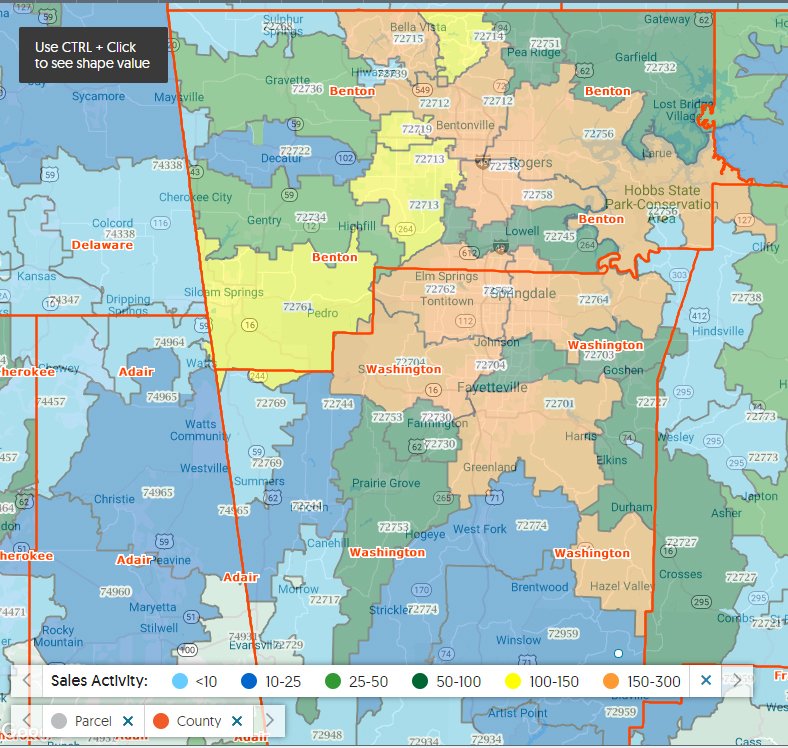
Number of Monthly Sales by Zip Code
Median Sale Price by Zip Code